
Introduction
Sooner or later a WordPress site shows a white screen, a cryptic error, or behaviour that makes no sense. The difference between a frustrating afternoon and a five-minute fix is whether you have debugging set up.
WordPress has a built-in debugging system controlled by a few constants in wp-config.php. Turn it on and WordPress tells you exactly what is wrong — the file, the line, and the error. Turn it off and you are left guessing.
This article shows you how to debug WordPress properly:
- Enabling WP_DEBUG the right way
- Logging errors to a file instead of showing them on screen
- Reading and understanding the debug log
- Using error_log() and Query Monitor to dig deeper
- Debugging safely on a live site
Why Debugging Matters
By default, WordPress hides PHP errors from visitors. That is correct for a live site — you do not want error messages on your home page. But during development it means problems happen silently.
Debugging makes the invisible visible. Instead of guessing why a page is blank, you read the exact error: “Fatal error: Uncaught Error: Call to undefined function in my-plugin.php on line 42.” Now you know what to fix.
The Core Debugging Constants
WordPress debugging is controlled by three constants in wp-config.php. Add them above the “That’s all, stop editing!” line.
define( 'WP_DEBUG',         true );
define( 'WP_DEBUG_LOG',     true );
define( 'WP_DEBUG_DISPLAY', false );
What each does:
- WP_DEBUG turns debugging on. WordPress now reports PHP errors, warnings, and notices it would normally suppress.
- WP_DEBUG_LOG writes those errors to a log file (wp-content/debug.log) so you have a permanent record.
- WP_DEBUG_DISPLAY controls whether errors appear on the page. Setting it to false keeps them off-screen while still logging them.
This combination — debug on, logging on, display off — is the recommended setup. You capture every error in a file without showing anything to visitors.
Why turn display off and logging on?
Showing errors on the page seems convenient, but it has problems. Errors can break your layout, leak file paths to anyone watching, and disappear the moment the page reloads. Logging captures everything in order, with timestamps, in one place you can search.
Finding and Reading the Debug Log
With WP_DEBUG_LOG enabled, WordPress writes errors to:
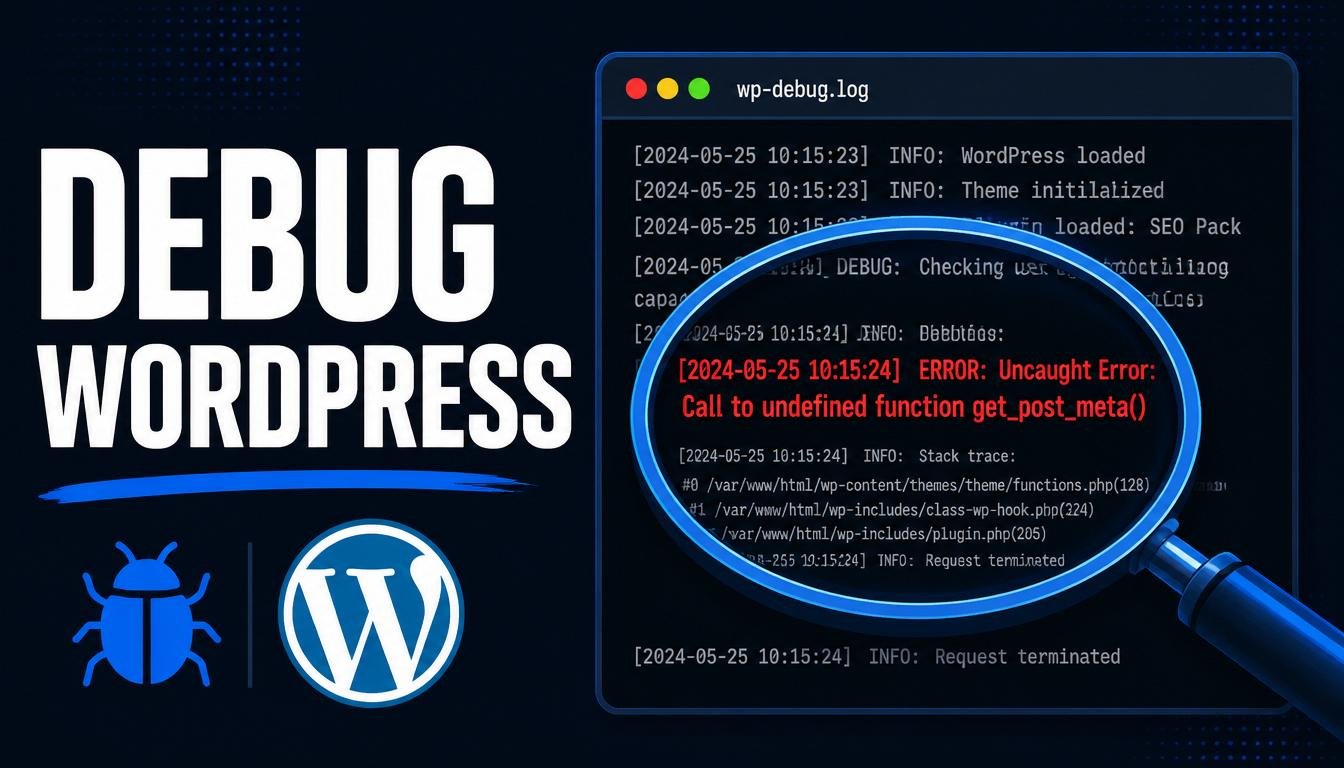
wp-content/debug.logThe file is created the first time an error occurs. A typical log entry looks like this:
[01-Jun-2026 09:14:22 UTC] PHP Warning: Undefined variable $title in /app/public/wp-content/themes/my-theme/single.php on line 18Read it from the inside out:
- The timestamp tells you when it happened.
- The error type (Warning, Notice, Fatal error) tells you how serious it is.
- The message describes the problem.
- The file path and line number tell you exactly where to look.
Understanding error severity
- Fatal error — stops execution. This is what causes white screens. Fix these first.
- Warning — something went wrong but PHP continued. Often worth fixing.
- Notice / Deprecated — minor issues. Clean these up over time, especially deprecations.
Extra Debugging Constants
SCRIPT_DEBUG
define( 'SCRIPT_DEBUG', true );By default WordPress loads minified CSS and JavaScript. SCRIPT_DEBUG tells it to load the full, readable versions instead. This makes front-end and block editor JavaScript far easier to debug in the browser.
SAVEQUERIES
define( 'SAVEQUERIES', true );This records every database query WordPress runs, along with how long each took. It is invaluable for tracking down slow pages and unexpected queries. Because it stores every query in memory, only enable it while actively investigating performance.
Logging Your Own Messages with error_log()
WP_DEBUG catches errors WordPress and PHP raise. But often you want to log your own values to understand what your code is doing.
PHP’s error_log() function writes to the same debug.log:
$user_id = get_current_user_id();
error_log( 'Current user ID: ' . $user_id );
For arrays and objects, wrap them in print_r() with its second argument set to true:
$order = wc_get_order( 123 );
error_log( print_r( $order, true ) );
This is the simplest, most reliable way to inspect what your code sees at runtime. It works everywhere — including AJAX requests and cron jobs where you cannot see screen output.
Pitfall: remove or comment out your error_log() calls before shipping.
Query Monitor: The Essential Debugging Plugin
For anything beyond reading a log file, install Query Monitor — the most widely used WordPress debugging plugin, free in the plugin directory.
Query Monitor adds a panel to your admin toolbar showing, for the current page:
- Every database query, how long it took, and which function or plugin triggered it
- PHP errors, warnings, and notices raised while building the page
- Which hooks fired and in what order
- The template file used and the template hierarchy that led to it
- HTTP API requests, REST API calls, and their responses
Use it on local and staging environments. Like all debugging tools, keep it off — or restricted — on production.
Debugging on a Live Site (Carefully)
Sometimes a bug only appears in production. You can debug there, but you must be careful not to expose errors to visitors.
- Set WP_DEBUG_DISPLAY to false so errors never appear on the page.
- Set WP_DEBUG_LOG to true so errors go to the log only.
- Move or protect the log. Consider logging to a non-public path.
- Turn everything off the moment you are done.
You can point the log somewhere safer by giving WP_DEBUG_LOG a path instead of true:
define( 'WP_DEBUG_LOG', '/home/user/private-logs/wp-errors.log' );This keeps the log outside the web root, where it cannot be reached by a browser.
Recovery Mode and Fatal Error Protection
WordPress has a built-in safety net for fatal errors. When a plugin or theme triggers a fatal error, WordPress can pause the offending code, keep the rest of the site running, and email the site administrator instead of showing visitors a broken page.
Clicking the recovery link in that email starts a temporary admin session where the broken plugin or theme is disabled just for you. The site stays up for visitors while you fix or remove the faulty code.
Seeing the raw error instead
During active development the fatal error handler can get in the way. You can disable it:
define( 'WP_DISABLE_FATAL_ERROR_HANDLER', true );Use this only in development. On a live site the handler is what stops a single bad plugin from taking the whole site down.
A Practical Debugging Workflow
- Enable WP_DEBUG with logging on and display off.
- Reproduce the problem while watching debug.log.
- Read the newest error — note the file and line number.
- If the cause is unclear, add error_log() calls to inspect the values your code is working with.
- Use Query Monitor if the issue involves queries, hooks, templates, or performance.
- Fix the cause, confirm the error stops appearing, then turn debugging off.
Best Practices
- Log, do not display. Keep WP_DEBUG_DISPLAY off and rely on the log.
- Never debug-display on production. Logging only, always.
- Install Query Monitor on every dev site.
- Clean up after yourself. Remove error_log() calls and turn off debugging constants before deploying.
- Pay attention to deprecation notices. They warn you about code that will break in a future WordPress or PHP version.
Common Mistakes
Leaving WP_DEBUG_DISPLAY on in production. The most serious mistake — it exposes file paths and errors to anyone.
Only setting WP_DEBUG without WP_DEBUG_LOG. Then errors have nowhere to go if display is also off. Enable logging to capture them.
Leaving SAVEQUERIES on permanently. It consumes memory on every request. Use it briefly, then disable it.
Forgetting to remove debug code. Leftover error_log() calls clutter the log and can leak data.
FAQ
Where is the WordPress debug log stored?
By default in wp-content/debug.log, created the first time an error is logged. You can change the location by giving WP_DEBUG_LOG a file path instead of true.
Why is there no debug.log file?
Either no errors have been logged yet, or logging is not enabled correctly. Confirm WP_DEBUG and WP_DEBUG_LOG are both true and that wp-content is writable.
Is it safe to enable WP_DEBUG on a live site?
Only with WP_DEBUG_DISPLAY set to false so errors are logged, not shown. Ideally log to a path outside the web root, and turn debugging off as soon as you finish.
How do I log a variable’s value?
Use error_log( $value ) for simple values, or error_log( print_r( $value, true ) ) for arrays and objects. The output goes to debug.log.
What is Query Monitor?
A free debugging plugin that shows database queries, PHP errors, hooks, template files, and HTTP requests for each page.
Conclusion
Debugging WordPress comes down to a small, reliable toolkit:
- WP_DEBUG with logging on and display off captures every error safely.
- The debug.log file tells you the exact file and line of each problem.
- error_log() lets you inspect your own code’s values at runtime.
- Query Monitor reveals queries, hooks, and templates that a log cannot.
Set this up once on your local environment and debugging stops being guesswork. You read the error, go to the line, and fix it.